Case Study 1: Problem 5 - Printable
| Home
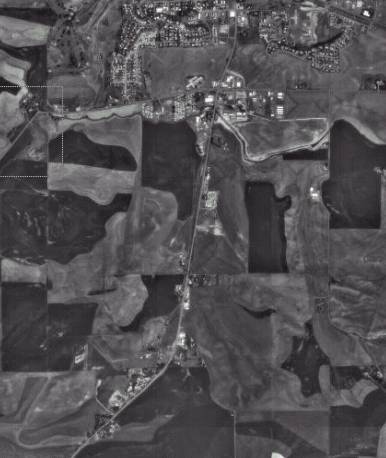
> Problem 5 Problem 5: U.S. 95 South of Moscow U.S. 95 continues south out of Moscow bound for Lewiston, ID, 32 miles to the south. Exhibit 1-41 shows an aerial photograph of about a four-mile stretch of the highway just south of Moscow. A short length of suburban two-lane arterial leads quickly to a rural two-lane highway. The state highway agency would like to evaluate the performance characteristics of U.S. 95 as a single facility. To help address this issue, we will explore issues related to the short section of U.S. 95 that acts as a main street for the somewhat developed area you can see toward the bottom of the aerial photograph. Currently, the development in this area does not generate much activity, but trip making is expected to increase over the next 10 years as the area grows. Current estimates are that 10 years from now U.S. 95 south of Moscow will carry about 1,100 vehicles per hour during the PM peak and about 700 of these trips will be generated by the development area (400 originating and 300 destined for this area). Another 300 will be bound toward Moscow from this area, which we will hereafter refer to as a hamlet. In addition, the hamlet will generate a total of about 2,000 vehicle trips during the PM peak (the 700 trips mentioned above are included in this figure), 100 of these trips will go to and from points further south, and the remaining 1,200 trips will be local within the hamlet. How will U.S. 95 operate in the future based on these forecast traffic conditions? Continue to the next page for additional discussion. |
Page Break
|
Home >
Problem 5 - Page 2 of 2 Problem 5: Signalization of Okeechobee Road The HCM suggests in Chapter 16 that Free-flowing right turns that are not under signal control should be removed entirely from the analysis. We have already established that the northbound and eastbound right turns are free flowing because of channelization. Therefore, neither of these movements will be considered as a part of the signalization. The current TWSC operation at this intersection provides only one lane for the northbound left turn. Because of the available space and the capacity advantage of a second lane under signal control, two lanes will be assigned to this movement. In addition, because of the geometrics of this T intersection, the northbound left turn has more of the characteristics of a through movement than a left turn. Therefore, for purposes of signal analysis, the northbound left turn will be considered as a through movement. The signal analysis sub-problems will be based on the following demand volumes:
Discussion: |
||||||||||||||||||||||||
Page Break
| Home
> Problem
5 >
Analysis Plans Problem 5: U.S. 95 south of Moscow It is also recognized that, in real terms, the range of potential solution alternatives to any deficiencies that might be identified is fairly limited:
Exhibit 1-42 shows a schematic of the area being studied. First, there is a 4.5 mile section of two-lane rural highway, then the 1-mile section through the hamlet, then another 4.5-mile section of two-lane highway. The figure also provides you a broad-brush sense of the traffic volumes. Whether a bypass is built or not, the figure shows that during the PM peak hour, there are 600 vehicles traveling south and 500 traveling north. Of the 600 coming south, 400 are destined for the hamlet, while the remaining 200 are going further south. Another 50 vehicles originate in the hamlet for trips further south so that the southbound volume below the hamlet is 250 vehicles per hour. In the northbound direction, the flow rate is 250 vehicles per hour just south of the hamlet. Fifty of these vehicles are destined for the hamlet and the remainder are traveling further north toward Moscow. An additional 300 trips originate in the hamlet bound for Moscow and further north. This means the northbound volume just above the hamlet is 500 vehicles per hour. Analysis
Plan Sub-problem 5a: Existing analysis of 10-mile segment of U.S. 95 Sub-problem 5b: Future analysis of 10-mile segment of U.S. 95 with recognition of the hamlet |
Page Break
| Home >
Problem 5 >
Sub-problem 5a - Page 1 of 5 Sub-problem 5a: Two-Phase Traffic Signal Control Step 1. Setup A two-phase control plan provides no protected phases for any of the left turns that are opposed by through traffic. The westbound approach has the only left-turn movement in this category. With a volume of 120 vph, it is conceivable that this movement could be accommodated without a protected phase. Many agencies would decide to provide a protected left-turn phase for this movement without further analysis, because of the high speed (50 mph) of the approaching traffic. The two-phase alternative is therefore presented in this sub-problem primarily as an illustration of the details of the HCM procedures. For many agencies, it will be a redundant step with respect to the decision itself. We will examine the two-phase alternative using both the Quick Estimation Method (QEM) presented in HCM Chapter 10 and the full operational analysis procedure presented in HCM Chapter 16. Consider the following as you proceed through this problem:
Discussion: |
Page Break
| Home
> Problem 5 >
Sub-problem 5a - Page 2 of 5 Sub-problem 5a: Two-Phase Traffic Signal Control Step 2: Results The QEM represents an extension of a technique known as Critical Movement Analysis, or CMA. This technique has appeared in the literature in several forms and is intended primarily for planning level analysis. The QEM produces an estimate of the status of the overall intersection with respect to its capacity, based on the assumption that the signal timing plan will produce an equal degree of saturation among the critical movements on each phase. The intersection status is determined from the sum of the v/c ratios for the critical movements on each phase. The QEM produces, as a by product, a synthesized signal operating plan consisting of:
The HCM offers the caveat that the synthesized plan may not be suitable for implementation because it does not include important considerations such as minimum green times. Nevertheless, it usually provides a good starting point for an operational analysis, which requires the signal timing plan to be specified along with several other items of geometric, operational, and traffic data that are not always available at the planning level. |
Page Break
| Home
> Problem 5 >
Sub-problem 5a - Page 3 of 5 Sub-problem 5a: Two-Phase Traffic Signal Control Both the QEM and the operational analysis procedure have the same underlying logic. In many places, the QEM uses assumed or default values and the operational analysis procedure uses more precise site-specific data. Therefore, some differences can be expected in the results, and those differences are generally attributable to the approximate nature of the QEM. The QEM provides two checks to evaluate the need for a protected left turn on each approach. The first involves computing the product of the volumes for the left turn and its opposing through movement. The cross product criterion has been described in the literature as a popular technique that generally preceded the availability of more complex computational models. Different cross product thresholds have been adopted by different agencies, and the threshold values are generally dependent on the number of available lanes. |
Page Break
| Home >
Problem 5 >
Sub-problem 5b - Page 1 of 7 Sub-problem 5b: Three-Phase Traffic Signal Control with a Protected Westbound Left Turn Step 1. Setup Having established the need for westbound left-turn protection in Sub-problem 5a, we will now examine the HCM treatment of protected left turns. Because of the isolated and high speed characteristics of this intersection, we would expect to implement a control scheme in which all movements are traffic-actuated. We will, however, limit the investigation to pre-timed control in this sub-problem, leaving traffic-actuated control for Sub-problem 5c. There are two reasons to separate the control treatment into different sub-problems. First, we can get a better idea of how these control modes differ if we examine both of them in detail. Second, the timing plan based on pre-timed control is often a useful input into the analysis of traffic-actuated operation. Consider:
Discussion: |
Page Break
| Home
> Problem 5 >
Sub-problem 5b - Page 2 of 7 Sub-problem 5b: Three-Phase Traffic Signal Control with a Protected Westbound Left Turn Step 2: Results The signalized intersection operational procedure requires a full specification of the signal timing plan as input data. Appendix A to HCM Chapter 16 provides some guidance on timing plan development. Three timing plan strategies are mentioned in the HCM:
Each of these strategies was applied to the intersection in question. To facilitate comparison of the effect of the strategy, the cycle length was fixed at 120 sec. The results are summarized for comparison in Exhibit 3-39.
|
|||||||||||||||||||||||||||||||||||||||||||||||||||||||||||||||||||||||||||||||||||||||||||||||||||||||||||||||||
Page Break
| Home
> Problem 5 >
Sub-problem 5b - Page 3 of 7 Sub-problem 5b: Three-phase Traffic Signal Control with a Protected Westbound Left Turn The Equal v/c
Strategy
The default yellow plus all red time for the QEM is 4 seconds per cycle per phase. The unusually wide intersection and high speed approaches dictates a longer inter-green period. For purposes of this discussion, values of 5 sec yellow and 1 sec all red will be used as an approximation of the local agency practice. While a 4-second inter-green is generally a reasonable default value for planning level analysis, this is a case in which the QEM assumptions do not apply to the intersection in question. |
Page Break
| Home
> Problem 5 >
Sub-problem 5b - Page 4 of 7 Sub-problem 5b: Three-phase Traffic Signal Control with a Protected Westbound Left Turn This analysis was repeated with two modifications. First, the inter-green times were increased from 4 sec to 6 sec. Second, the green times were redistributed by trial and error to produce a closer agreement between the v/c ratios for the critical movements. The results are shown in the next column of Exhibit 3-39. The following observations are offered:
|
Page Break
| Home
> Problem 5 >
Sub-problem 5b - Page 5 of 7 Sub-problem 5b: Three-phase Traffic Signal Control with a Protected Westbound Left Turn The Equal Delay Strategy
|
Page Break
| Home
> Problem 5 >
Sub-problem 5b - Page 6 of 7 Sub-problem 5b: Three-phase Traffic Signal Control with a Protected Westbound Left Turn These observations reinforce the notion that, in the search for an equitable distribution of green times, there is a tradeoff between equalizing the v/c ratios and equalizing the delays. The question of which strategy is preferable raises an interesting philosophical question. Note that equalizing the delays has reduced the overall intersection LOS from C to D. So a reporting scheme that considers only the overall LOS would tend to favor the equal v/c strategy. On the other hand, the improvement in overall intersection LOS was achieved at the expense of the lower volume movements that were forced to operate at LOS E and F. So, a reporting scheme that is concerned with individual movements might look more favorably on equalizing the delay. This debate might spawn a third strategy, namely that of equalizing the LOS among the competing movements without worrying too much about differences in delay. The results would be expected to fall somewhere between the two strategies that we have explored. Now here is a question to ponder. Why is the overall intersection delay of 42 sec per vehicle lower than the delays for any of the movements shown in Exhibit 3-39 The answer is that our analysis has focused on the critical movements and has neglected other movements such as the WB through traffic, which was not involved in any of the computations for the signal timing strategies we explored. The procedure prescribed by the HCM for estimating overall intersection LOS takes all movements into account, not just the critical movements. |
Page Break
| Home >
Problem 5 >
Sub-problem 5c - Page 1 of 6 Sub-problem 5c: Pre-timed vs. Traffic-Actuated Operation Step 1. Setup In Sub-problem 5b, we explored various strategies for allocating green time with pre-timed control. Because of the isolated high-speed nature of this intersection, it is important that traffic-actuated control be used. In this sub-problem, we will examine the HCM treatment of traffic-actuated control to see how it differs from pre-timed control. Consider:
Discussion: [ Back ] to Sub-Problem 5b [ Continue ] with Sub-Problem 5c |