|
Sub-problem 1b - Page 5 of 7 |
ID# C401B05 |
Sub-problem 1b: Analysis of
the Eastbound Freeway Section
Since we don’t have any formal data for the percentage of trucks/buses or
recreational vehicles in the traffic stream (during the peak hour), we’ll
use anecdotal observations and say that the percentage of trucks/buses is
about 5% (which means PT is 0.05). We will assume there
is no significant volume of recreational vehicles in the traffic stream.
Referring to Equation 23-2 in
the HCM, we have V = 3,340 veh/hr, PHF = 0.90, N =
2, PT = 0.05, PR = 0, ET
= 1.5, ER = 1.2, and fp = 1.0. This gives
us an average 15-minute passenger-car equivalent flow rate, vp of 1,902 passenger cars per hour per
lane.
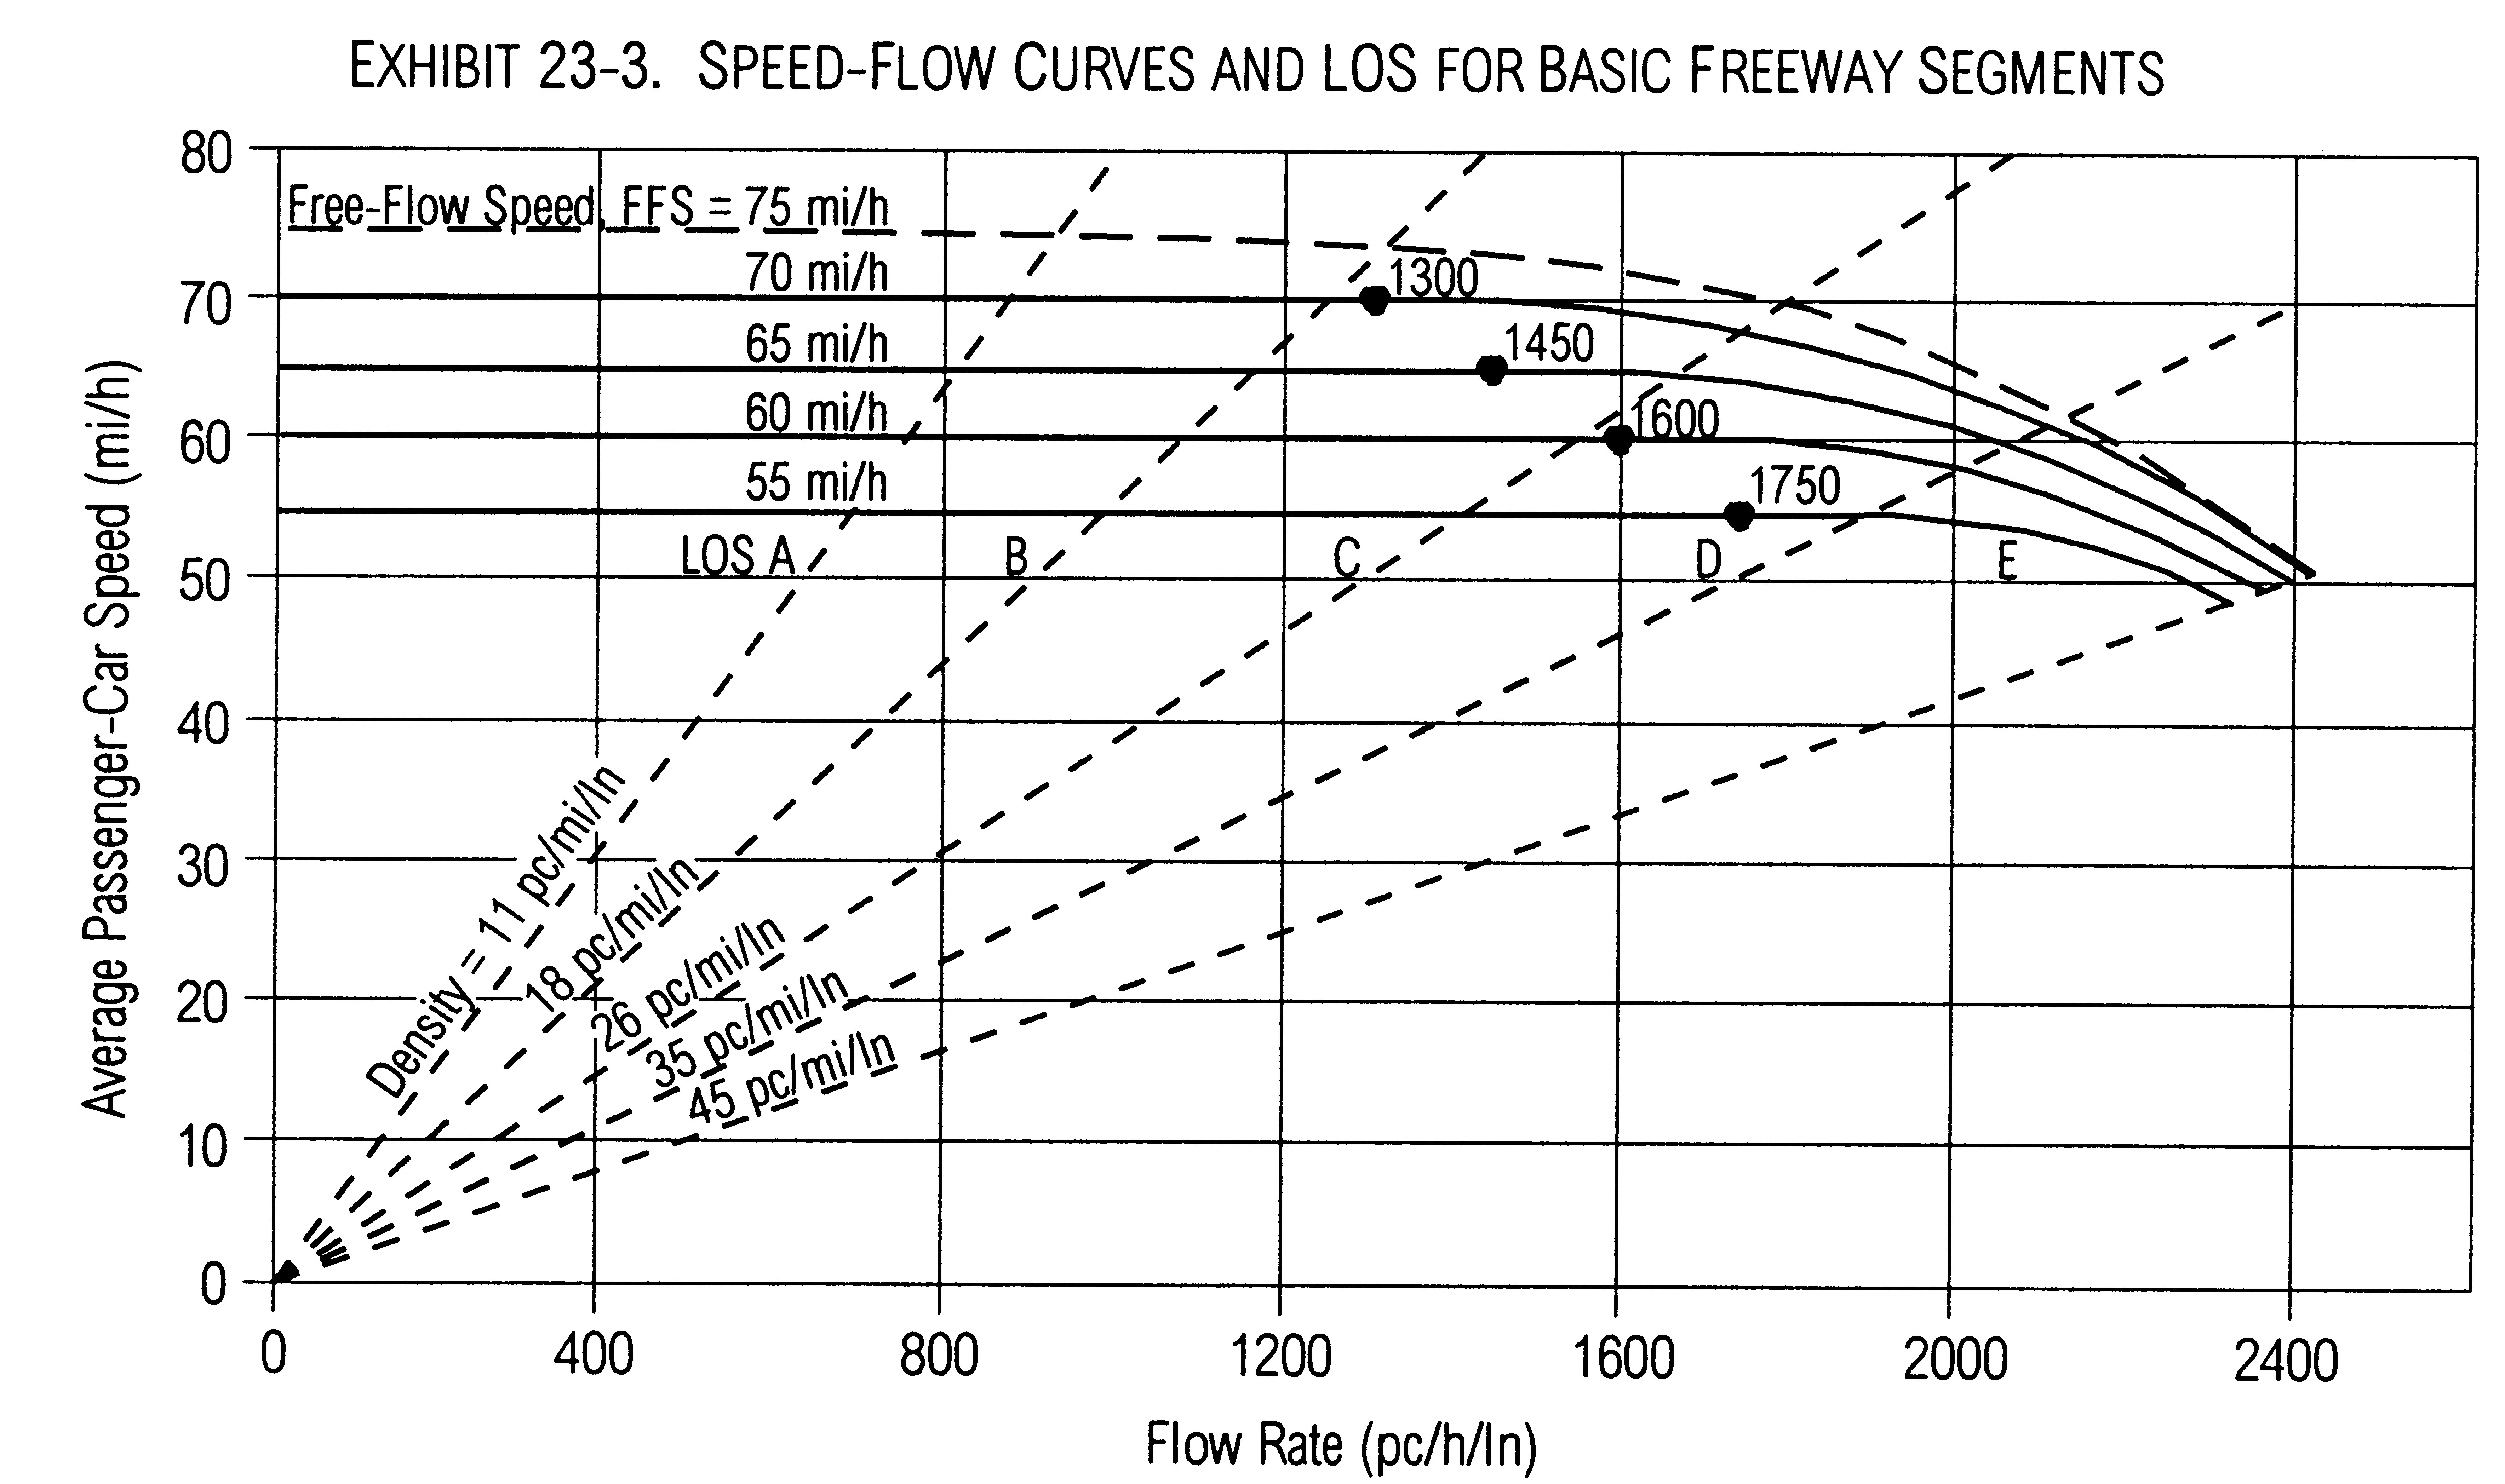
There’s one more thing to do before we assess the level of service (LOS) for
the facility, and that’s to compute the average passenger car speed
as shown on HCM page 23-5, using a set of equations based on Exhibit 4-12.
The equations break the speed-flow relationship shown in Exhibit 4-12 into a
set of regions delineated as follows:
|
If (55 ≤ FFS
≤ 75 mph) and ( vp ≤ 3,400 – 30* FFS ), then |
|
(4) |
S = FFS |
|
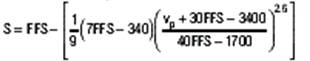
If (55 ≤ FFS
≤ 70 mph) and (3,400 – 30* FFS < vp ≤ 1,700 + 10*FFS), then |
|
(5) |
 |
|
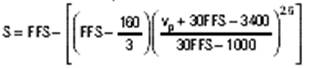
And if (70 <
FFS ≤ 75 mph) and (3,400 – 30*FFS) < vp ≤
2,400, then |
|
(6) |
 |
[
Back ] [ Continue
] with Sub-problem 1b