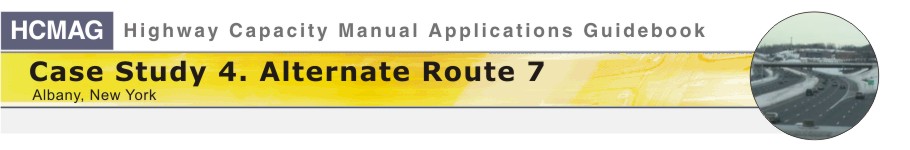
Overview This case study focuses on a three-mile section of New York State Route 7 (NY-7) just north of Albany, NY (see Exhibit 4-1). Called Alternate Route 7 by the locals (because it replaced a more southerly parallel suburban arterial), it has become a very busy highway. NYSDOT (New York State Department of Transportation) thinks this freeway and its adjacent interchanges need to be studied because of traffic congestion issues. Assume that you’ve recently been hired by NYSDOT to determine what kinds of improvements should be made to mitigate operational and safety deficiencies in this sub-area network. Key issues that the Department would like you to explore include:
The main caveat is that there is limited funding for improvements. So NYSDOT isn’t expecting costly solutions. However, the Department is expecting you to compare and contrast your “low-cost” solutions with ones that are more costly, where the greater expenditure would produce more benefits. |
Page Break
Overview We’re going to consider these issues and others through a series of five problems. Each one illustrates different facets of the deficiency analysis. Each one also illustrates how the various traffic analysis tools in the Highway Capacity Manual can be applied to assist traffic analysts, engineers, planners, and decision-makers in making sound investment decisions regarding changes to a transportation system. The problems focus on the chapters of the HCM that deal with uninterrupted facilities. We start with basic freeway sections, then go on to weaving sections and ramps, apply the freeway systems methodology to the NY-7 portion of the subarea network, and conclude with a simulation model for the subarea as a whole. After working through this material, you should be able to:
|
Page Break
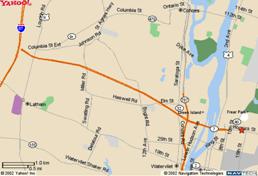
Introduction Before doing the analyses, we should familiarize ourselves with how Alternate Route 7 fits into the local freeway network. As Exhibit 4-2 shows, Alternate Route 7 runs east-west, between I-87 and I-787. (Technically I-787 is NY-787 north of the NY-7 interchange.) It is part of a grid-like freeway network that ties together the major cities in the Albany area. People who commute to Albany from the north enter the freeway grid on I-87 (at the top of the figure), travel Alternate Route 7 to I-787 then south to Albany. People who commute to Troy from the west enter the freeway network on I-90 (at left in the figure), travel up I-87 to Alternate Route 7 then to Troy. People from the south enter the freeway network on I-87 (at the bottom of the exhibit). If they’re going to I-87 north and know the network, they travel up I-787 to Alternate Route 7 then back to I-87. Discussion: |
Page Break
|
Exhibit 4-2. Albany Area Freeway Network
|
Page Break
Introduction The overall subarea network that is the focus of this case study is shown in Exhibit 4-3. Alternate Route 7 is in the middle of the figure. I-87 is on the left and I-787 is on the right. The drawing is not to scale and the Alternate Route 7 segment in the middle has been shortened. While congestion in the Alternate Route 7 subarea network is not bad overall, there are two places where significant queuing takes place: the I-787 interchange (viz., on the right-hand ramp leading from NY-7 East to I-787 South); and the I-87 interchange (viz., the right-hand ramp leading from NY-7 west to I-87 north). In both cases, the queues can be more than a mile long when traffic is heavy. For example, some mornings the line for the right hand ramp at the I-787 interchange extends halfway back to I-87. Similarly, on Fridays, especially in the summer, and on many weekday afternoons, the queue for the right-hand ramp from NY-7 and I-87 extends halfway back to I-787. Alternate Route 7’s basic freeway section is about four miles long, with two lanes eastbound and three lanes westbound. The third lane westbound is used by trucks that are climbing the grade that starts at the Hudson River and ends near Miller Road. From there to I-87, the third lane becomes an extension of the right-hand ramp leading to I-87 north. The interchanges at either end of Alternate Route 7 are good facilities to study. The I-787 interchange has short weaving sections, complicated merging geometries with tight geometry, and an auxiliary lane eastbound that separates the ramps from the main traffic lanes. The I-87 interchange has similar problems with short weaving sections and complicated merges and diverges. |

Page Break
|
Exhibit 4-3. Study Network Single Line Drawing
|

Page Break
Introduction The case study uses five problems to explore a variety of issues:
Each problem illustrates something important for a traffic engineer to do to find solutions to the facility’s problems. We are not going to present the entire subarea analysis but rather portions of it. We’re going to use the treatment identification setting as a backdrop to illustrate use of the HCM analysis procedures. Consequently, we’re going to focus on specific intersections and conditions to illustrate specific types of analyses and issues. |
Page Break
Getting Started
Scope Discussion: |
Page Break
Getting Started
Stakeholders
Over the course of the project, we will need to consider the benefits and costs that accrue to each of these groups in every aspect of the case study. Related to the stakeholders is the choice of audience. In this case, it is NYSDOT, who will share your results with the county, the town, and other interested parties. Your audience could also be the system users or the adjacent landowners, if they request a presentation about your findings. Discussion: |
Page Break
Getting Started Performance measures are related to the goals and objectives. Density is used for determining level of service (LOS) for almost all freeway facilities. Most traffic engineers use average passenger car speed as an indication of how well a facility is performing. Another performance measure is delay, which is defined here as the incremental travel time produced by the congestion present in the system. Queues are also important, although the HCM methodologies don’t provide easy ways to determine how long the queues are. Other criteria are travel times through the network, total vehicle-hours of travel, total vehicle miles, air pollution outputs, and noise impacts. For this case study, we will focus on density, speeds, and delays. |
Page Break
Getting Started
What Analyses to
Perform Regarding the interchange-level analyses, there are 40 ramps in the network: five interchanges with eight ramps each (consisting of left- and right-hand ramps for each directional approach). If we consider the AM and PM peaks, plus directional analyses on Alternate Route 7, we would do 84 separate analyses. Rather than presenting that many analyses, we will focus on specific problems to illustrate how to use the HCM. These problems are listed in Exhibit 4-4. For each, we’ve identified the situation to be analyzed (e.g., the school complex entrance during the AM peak) and the learning objectives and analysis issues that will be highlighted by that problem. The learning objectives are grouped into three stages: setting up the problem, doing the analysis, and results interpretation. The issues break into scope (e.g., geographic boundaries, time periods), demands (e.g., demand vs. volume), and geometrics. |
Page Break
|
Exhibit 4-4. Topics Covered in Case Study 4
|

Page Break
Getting Started
Sequencing, Tools, and
Data In choosing the tools to use, you should pick those that strike a balance between the amount of effort they require and the amount of insight they provide. In this case study, we’re going to use two tools: 1) the HCM for all of the intersection analyses and the location-specific analyses at the freeway interchange; 2) VISSIM for a micro-simulation-based analysis of the entire network, to help us understand the interplay between the various facilities and add more detail. Since the main purpose of this Guidebook is to illustrate how the HCM can be used to study traffic issues, we’ll use that tool wherever possible. We’ll also talk about where it isn’t applicable, explain why, and show you other tools that can be used. We will need two types of data: 1) facility-related information (e.g., number of lanes, lane widths, lane configurations, saturation flow rates) and 2) traffic-related information (e.g., vehicular volumes and demands). We’ll show the specific data required for each problem as that problem is presented. We also need to know how NYSDOT designs highway facilities and the expectations it has for operational details. When we reach the system-wide level of analysis, we need to know simulation model inputs, such as lane changing and car following behavior as well as the origin-to-destination flow patterns. |