Overview
This case study is about a Traffic Impact Assessment for a proposed site development in Clifton Park, New York (see Exhibit 2-1). The large parcel of land in question is south of where Maxwell Drive intersects with Clifton Park Boulevard (State Route 146). Like most impact assessments, the main question is this: in the horizon year for the analysis, what geometric improvements will be required to mitigate the impacts of the site development in conjunction with normal traffic growth? The Town of Clifton Park and New York State Department of Transportation (NYSDOT) both have roles to play in the decision-making. So do Saratoga County, the town’s citizens, the nearby land owners, and the developer. There are issues about how many intersections should be studied, what time periods should be examined, what goals and objectives should be used, and what performance measures should be employed. To address these issues and others, the
case study includes six problems. They range in scope from a single
intersection to a sub-area network. Each one illustrates some aspect of the
impact assessment. Each one also illustrates how various traffic analysis
tools in the
Highway Capacity Manual can be applied to
assist traffic analysts, engineers, planners, and decision-makers in making
sound investment decisions regarding changes to a transportation system. The problems focus on the chapters of the HCM that deal with interrupted flow facilities, especially signalized intersections, arterials, freeway interchanges, and arterial weaving. After studying this material, you should be able to:
|
Page Break
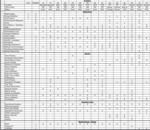
Overview There are many ways to classify traffic analysis problems that are appropriate for analysis with the HCM. The graphic below includes seven categories. The kinds of problems that are addressed in this chapter, within these seven categories, are highlighted in BLUE.
|
Page Break
Introduction
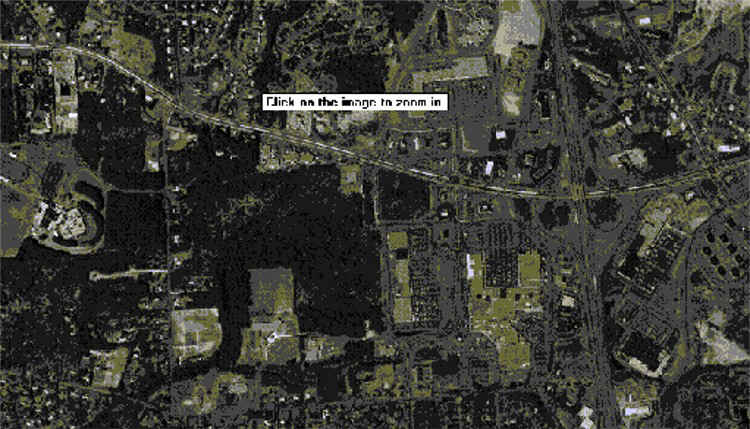
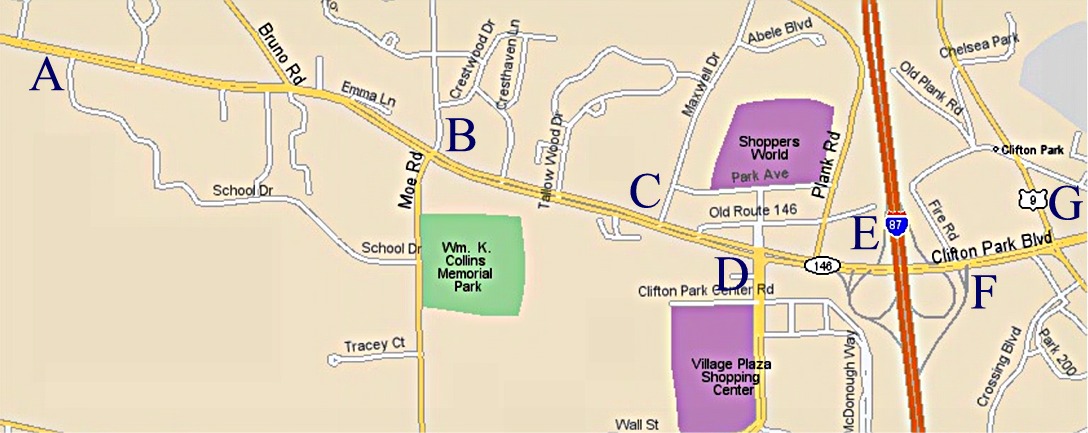
Route 146 (Clifton Park Boulevard) is a major multi-lane arterial in Clifton Park, New York. It serves trips to and from three major shopping centers, a local school district campus, and many commercial and residential areas. Route 146 also connects these areas to Interstate 87 (the Northway) for trips toward Albany and Montreal. Route 146 is the main street for the town. Shopping centers on either side are the downtown. Route 146 is also a major link between Schenectady on the west and Mechanicville on the east. Exhibit 2-1 shows the section of Route 146 that is the focus of this case study. Much vacant land south of intersection C (Maxell Road) is still available for development, as is evident in Exhibit 2-2. As development occurs, traffic impacts will result. Geometric and operational changes will be needed to maintain acceptable operations at roadway intersections. At a minimum, the northbound approach will have to be added at intersection C, but there will be other improvements as well. We have been tasked with determining what those geometric and operational changes should be. We’re going to do a generic traffic impact analysis (TIA) for this corridor. As is common in TIA’s, we are going to focus on three conditions (the AM peak hour, the PM peak hour, and the peak hour of the generator, with the implicit assumption, at least initially, that the last is one of the former two) for existing and future conditions. Moreover, for the future conditions, we’re going to examine the network’s performance with and without the development. We are not going to present the entire TIA, just portions of it. We’re going to use the TIA setting as a backdrop against which to illustrate use of the HCM analysis procedures. Consequently, we’re going to focus on specific intersections and conditions to illustrate specific types of analyses and issues. |

Page Break
| Exhibit 2-1. Route 146 in Clifton Park |
 |
|
Location: A - Route 146 and School Drive B - Route 146 and Moe Road C - Route 146 and Maxwell Drive D - Route 146 and Clifton Country Road E - Interstate 87 Interchange F - Route 146 and Interstate 87 NB off-ramp G - Route 146 and Route 9 |
Page Break
|
Exhibit 2-2. Aerial photograph of Route 146 |
Page Break
Getting Started
To begin this case study, issues relating to setting the scope, goals, objectives, the analysis methodology, the sequencing of the analysis, the tools to use, and the data to be employed will need to be identified. Each of these topics will be addressed in this section.
|
Page Break
Getting Started Scope with Getting Started |
Page Break
Getting Started Next, let’s consider who the stakeholders are. The town is clearly one of them. The users are another. Other interested parties would be the county (Saratoga County), nearby property owners, the shopping center owners and tenants, and the school district. The school district is important because its main campus is just south of intersection A. When you’ve decided who all these groups are, consider the benefits and costs that accrue to each of these groups in every aspect of the case study. Related to the stakeholders is the choice of audience. In this case, it is the town, with the caveat that the town would then forward your report to NYSDOT. Your audience could also be the system users or the adjacent land owners, if they request a presentation about your findings. Discussion: |
Page Break
Getting Started Goals and Objectives Related to the goals and objectives are performance measures by which the system’s performance is evaluated. In many cases, they’re easy to identify. Delay is one that’s common. Another is level of service (LOS). (Sometimes delay implies level of service.) Others are total vehicle hours of travel, total vehicle miles, air pollution outputs, and noise impacts. For this case study, we will focus on delays and queues. Discussion:
with Getting Started |
Page Break
Getting Started What Analyses to Perform For the entire TIA, at least 45 intersection-level analyses are involved. That’s based on five intersections (A, B, C, D, and G), three time periods (AM peak, PM peak, and Saturday midday), and three conditions (existing, future without, and future with). In addition, for the freeway interchange, you need to study at least seven locations: the terminus of the southbound-to-westbound off-ramp, the entrance to the southbound on-ramp, the terminus of the northbound off-ramp (signalized intersection F), the two ramp junctions on I-87 northbound, the ramp junction on I-87 southbound, and the eastbound weaving movement under the I-87 bridges between the southbound-to-eastbound off-ramp and the eastbound-to-northbound on-ramp. That means 63 more analyses: seven locations for three time periods and three conditions. As indicated, we’re not going to present all 108 analyses. Instead, we’re going to focus on specific problems that let us illustrate how to use the HCM. The problems we are going to consider are listed in Exhibit 2-3. For each, we’ve identified the situation that will be analyzed (e.g., the school complex entrance during the AM peak) and the learning objectives and analysis issues that will be highlighted by that problem. The issues can be divided into scope (e.g., geographic boundaries, time periods), demands (e.g., demand vs. volume), geometrics, and signal control (e.g., critical movements). After we've completed the problems, we will extend what we’ve observed to speak more generally about conclusions and insights that would relate to the overall TIA. These insights are important to effectively communicate important findings to your audience and the other stakeholders. They also help with sensitivity analysis and ensure that the solutions are feasible. Discussion:
with Getting Started |
Page Break
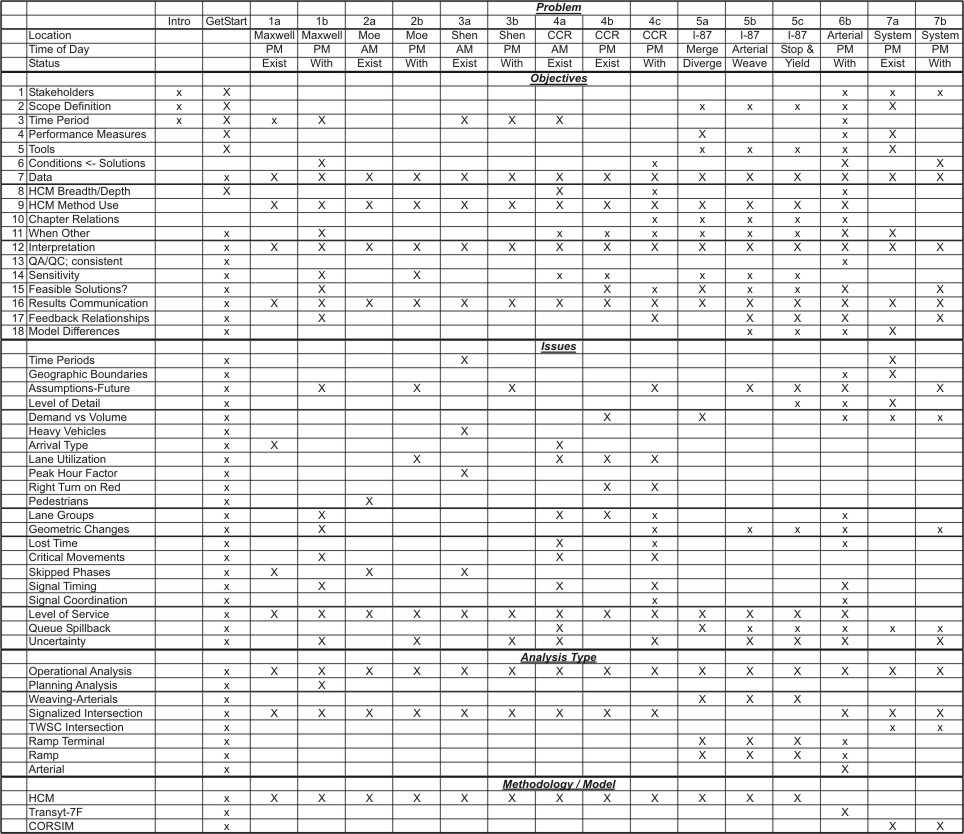
|
Exhibit 2-3. Case Study Problems
|
Page Break
Getting Started Sequencing, Tools, and Data Choosing the tools to use is another issue. You have to pick ones that strike a balance between the amount of effort they require and the amount of insight they provide. In this case study, we’re going to use two tools. The first is the Highway Capacity Manual. We’ll use it for all of the intersection analyses and the location-specific analyses at the freeway interchange. The second is Transyt-7F. We’ll use it to do an arterial analysis of intersections A through D. It will help us ascertain what coordinated signal timings would work best for that set of signals. It should be emphasized that we are using Transyt-7F here to illustrate the use of non-HCM procedures, and other programs could also be used with equal effectiveness. Since the main purpose of this guidebook is to illustrate how the HCM can be used to study traffic issues, we’ll use this tool wherever possible. We’ll also show where it isn’t applicable, explain why, and illustrate how other non-HCM tools can be used.
|
Page Break
Getting Started Discussion:
|