Problem 6: Planning Level Analysis Thus far, we have taken an operational perspective in our analysis. Occasionally, when we are considering future conditions, we are better served by looking at a less detailed level of analysis, often called a planning level analysis. Let's take this planning perspective now, considering the twenty-year traffic projections. All of the intersections on U.S. 95 will be examined to assess their sufficiency at the end of the twenty-year period. The signalized intersection quick estimation procedures contained in Appendix A to Chapter 10 of the HCM 2000 will be applied for this purpose. The question to consider now is whether or not the number of lanes at the U.S. 95/Styner-Lauder Avenue intersection will be sufficient to accommodate the projected traffic demand over the twenty-year planning horizon. A uniform increase of two-percent per year will be applied to the current volumes on all traffic movements. Compounded annually, the two-percent annual increase will produce a growth factor of 48.6% to apply to the current volumes. The quick estimation method covers all aspects of signalized intersection analysis, including determination of left-turn treatments, lane-volume computations, estimation of signal timing plans, calculation of the critical v/c ratio, and calculation of average control delay. The delay calculations use the same mathematical procedures as the operational analysis method, except that certain details, such as pedestrian minimum times, are excluded from consideration. Liberal use is made of assumptions and approximations. This method is well suited to analysis of conditions projected over the long term where the accuracy of the traffic volumes is questionable and immediate implementation of results is not an issue. The method will be applied to each of the intersections on U.S. 95 in separate sub-problems: Sub-problem 6a: Planning Analysis at Palouse River Drive Sub-problem 6b: Planning Analysis at Styner-Lauder Avenue Sub-problem 6c: Planning Analysis at Sweet Avenue Sub-problem 6d: Planning Analysis at SH-8 [ Back ] to Problem 5 Discussion [ Continue ] to Sub-Problem 6a |
Page Break
Sub-problem 6a: Planning Analysis at Palouse River Drive The Idaho Transportation Department has provided historic traffic volume data for U.S. 95 to help determine a historic growth rate. This data suggests an annual growth rate of 3.4 percent per year over the past 20 years, and 2.6 percent over the past 10 years. The City of Moscow has provided planning model volumes that project 20-year traffic growth on the U.S. 95 corridor to be 50 percent over the next twenty years. Based on this information, what is the number of lanes required for the intersections along the U.S. 95 corridor in twenty years, assuming an annual traffic growth rate along the corridor of two percent? In sub-problem 6a, we will use the planning analysis technique to evaluate conditions that occur when traffic is leaving a football game at the University of Idaho. Demand is high for about an hour after the conclusion of the game and the U.S. 95 corridor experiences a high level of congestion during this period. Consider the following:
Discussion: |
Page Break
Sub-problem 6a: Planning Analysis at Palouse River Drive The twenty-year projected volumes for this intersection, adjusted for the peak hour factor are shown in Exhibit 1-48. These projections can be obtained by applying a 2.0 percent growth rate, compounded annually, to the existing peak-hour traffic volumes.
Each of the steps in the quick estimation method will be presented in detail in this sub-problem. The method involves a series of five detailed worksheets on which the data are entered and computations are performed.
The quick estimation steps are as follows (click on each step to see a more detailed discussion): For purposes of this discussion, the detailed computations are skipped and the results are summarized in Exhibit 1-49:
|
||||||||||||||||||||||||||||||||||||||||||||||||||||||||||||||||||||||||||||||||||||||||||
Page Break
Sub-problem 6b: Planning Analysis at Styner-Lauder Avenue A similar evaluation will be performed for the Styner-Lauder intersection, but the detailed discussion found in sub-problem 6a will not be repeated here; projected traffic volumes at Styner-Lauder are much lighter than at Palouse River Drive.
Similar to the discussion included in sub-problem 6a, consider the following questions for a planning analysis with light volumes as found at the Styner-Lauder Avenue intersection:
Discussion: |
Page Break
Sub-problem 6b: Planning Analysis at Styner-Lauder Avenue The twenty-year projected volumes for the Styner-Lauder Avenue intersection, adjusted for the peak hour factor are shown in Exhibit 1-50.
Click here to see the cross-product calculations. None of the left-turn cross products suggests any need for left-turn protection, so a two-phase operation will be used.
Exhibit 1-51 shows the results from this exercise. Even with the 20-year traffic volume projections, the critical v/c ratio is only 0.52. These results let us say with great confidence that the existing intersection configuration will be able to accommodate the anticipated traffic 20 years from now with no operational problems or congestion.
|
|||||||||||||||||||||||||||||||||||||||||||||||||||||||||||||||||||||||||||||||||||||||||
Page Break
Sub-problem 6c: Planning Analysis at Sweet Avenue The U.S. 95/Sweet Avenue intersection has only three approaches. The planning level analysis of a T-intersection leads to some questions to consider:
Discussion: |
Page Break
Sub-problem 6c: Planning Analysis at Sweet Avenue The twenty-year projected volumes for this intersection, adjusted for the peak hour factor, are shown in Exhibit 1-52.
This is a T-intersection with no approach for westbound traffic. The northbound movement has the only left turn opposed by through traffic. That movement now has a protected left turn phase. Therefore, it is not necessary to apply the cross product computational step to this sub-problem, because the left-turn treatments have already been determined for all approaches. Instead we must specify the type of protection for each approach.
The choices are:
Discussion:
|
||||||||||||||||||||||||||||||||||
Page Break
Sub-problem 6c: Planning Analysis at Sweet Avenue For this example, the Northbound left turn is protected, the eastbound left turn is not opposed, and the other two left turns do not exist. The analysis results are presented in Exhibit 1-53. Note that the minimum cycle length of 60 seconds will accommodate the projected 20-year traffic volumes with no apparent operational problems.
Notice also that, even though this is a T-intersection with no westbound approach, the phasing designation for east west traffic is EBWBTH, indicating the presence of westbound vehicles. This is an important principle that describes the way that traffic movements are represented in the Quick Estimation model. The principle is that, for the Quick Estimation method, all movements must exist in the model. Those that don’t exist on the street are simply assigned zero volume and capacity. This is an important distinction between the Quick Estimation method and more detailed traffic models. As indicated above, the HCM quick estimation method distinguishes between protected and protected-plus-permitted left-turn treatments. It is important to note, however, that the mathematical treatment of the permitted phase differs from the full operational procedure. The full operational procedure computes a capacity for vehicles turning left on the permitted phase, based on advance knowledge of the signal timing plan. The Quick Estimation procedure does not require this information, and cannot, therefore, perform the computations at the same level of detail. This is an essential feature of the tradeoff between the reduced data requirement for planning level applications and the amount of detail that can be expected in the results. |
|||||||||||||||||||||||||||||||||||||||||||||||||||||||||||||||||
Page Break
Sub-problem 6c: Planning Analysis at Sweet Avenue The quick estimation method takes protected plus permitted phasing into consideration by subtracting two sneakers per cycle from the left-turn volume. The volume is not reduced at all for protected only operation, and it is not reduced below four vehicles per cycle in either case. The four vehicles per cycle lower limit was imposed to prevent unreasonably short left turn phases from occurring in the sequence. If the cycle length is not known, the HCM suggests using the maximum allowable cycle length to provide a conservative estimate. For planning level analysis with projected volumes, many analysts prefer not to count on the additional permitted phase to provide capacity for left turns well into the future. There are several reasons, including safety problems, that a protected left turn supplemented by a permitted phase today may not be able to retain that option twenty years from now. Consider what would happen if the phasing for this example were modified to allow the left turn to proceed on the solid green for north-south traffic. The full operational procedure would assign some additional capacity to the left turn, thereby reducing the delay, and possibly improving the level of service. The quick estimation method, on the other hand, would see a much smaller difference in the operation. Based on the maximum cycle length of 120 seconds, four vehicles per cycle would create a volume of 120 vph. So the left-turn volume entry would be reduced from 152 vph to 120 vph, but no other benefit of the permitted phase would be applied. |
Page Break
Sub-problem 6d: Planning Analysis at SH-8 Intersection The same quick estimation will be done for the U.S. 95/SH-8 intersection with the following issue to consider:
Discussion: |
Page Break
Sub-problem 6d: Planning Analysis at SH-8 Intersection The twenty-year projected volumes for this intersection, adjusted for the peak period factor are shown in Exhibit 1-54.
This is an unusual intersection that will require careful thought before applying the quick estimation method. Look again at Exhibit 1-4. The departure roadway to the north is one-way away from the intersection, and the west leg of the intersection is one-way eastbound. Therefore, there is no westbound through movement, no northbound left turn, and no southbound traffic at all.
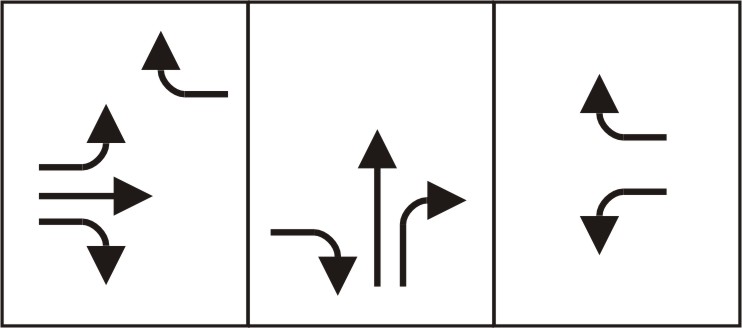
So, the first thing to consider is the type of treatment (permitted, protected, protected plus permitted or not opposed) to specify for each of the left turns. Exhibit 1-55 shows the signal phasing that is currently being used. The eastbound and westbound movements are fully separated, and so the "Not Opposed" treatment will apply. While the northbound and southbound left turns do not exist, they must be specified as permitted because of the way that the quick estimation method represents traffic movements. For more detail on this subject, see the discussion presented under sub-problem 6c. |
||||||||||||||||||||||||||||
Page Break
Sub-problem 6d: Planning Analysis at SH-8 Intersection The results of this analysis (critical v/c ratio = 1.23), shown in Exhibit 1-56, indicate that the existing geometric configuration and signal timing would not accommodate the projected volume. This could indicate the need for intersection improvements, but first we must be sure that the quick estimation method is representing the operation realistically.
We should begin by looking at the right turns. The quick estimation method assumes that the right turns will proceed only on the concurrent through traffic phases. The phasing plan presented in Exhibit 1-55 indicates that both the eastbound and westbound turns are served during other phases as well. Therefore, these movements may have some capacity that is not being recognized by the quick estimation method. The HCM suggests that "when an exclusive right-turn lane movement runs concurrent with a protected left-turn phase from the cross street...the total right-turn volume for the analysis can be reduced by the number of shadowed left-turners." The shadowing movements for the EB and WB right turns are actually through movements in this case because of the peculiar intersection geometrics. The EB right turn is shadowed by the NB through movement, and the WB right turn is shadowed by the EB through movement. In both cases, the lane volumes of the shadowing movements exceed the lane volumes of the shadowed right turns. Therefore, it would be reasonable to remove the EB and WB right turns from the analysis. |
||||||||||||||||||||||||||||||||||||||||||||||||||||||||||||||||||
Page Break
Sub-problem 6d: Planning Analysis at SH-8 Intersection The NB right turn is shadowed by the WB left turn, which takes place from two lanes. From Exhibit 1-54, the total WB left turn volume is 254 vph or 127 vph per lane. So, it would be appropriate to reduce the NB right turn volume of 305 vph by 127 vph to give an effective volume of 178 vph. The removal of the EB right turn and the reduction of the NB right turn volume do not affect the results, because the through movement is the critical movement that governs both of these approaches. On the other hand, the right turn is the critical movement on the westbound approach. So, the elimination of that movement will benefit the operation of the whole intersection. Exhibit 1-57 indicates that the removal of the right turns from the WB approach will reduce the estimated critical v/c ratio to from 1.23 to 0.88, indicating a “near capacity” condition. We could conclude from this analysis that the intersection could probably accommodate the additional 20 year traffic volumes without the need for geometric improvements.
A final note on the importance of the specified cycle length range in the Quick Estimation Method: note that the results for Sub-Problem 6a, Sub-Problem 6b and Sub-Problem 6c indicated a computed cycle length at the minimum of the specified range and a “below capacity” status. Our first attempt at Problem 6d indicated a computed cycle length at the maximum of this range and an “above capacity” status”. After the right turns were modified, a 120-second cycle length was indicated in Exhibit 1-57 as the “specified cycle length.” As a general rule, if the adequacy of the potential capacity of the intersection is being evaluated, the maximum allowable cycle length should always be used. If a cycle range is specified, then the results could be misleadingly pessimistic because of the capacity reduction effect of shorter cycle lengths. |
||||||||||||||||||||||||||||||||||||||||||||||||||||||||||||||||||
Page Break
Problem 6-Analysis Simple as they may be, planning-level analyses such as the ones conducted in this problem are powerful tools for the planner, designer, and engineer. Often, the underlying objectives (i.e., the questions that are being asked and the reasons the analyses are being undertaken) can be addressed with an adequate level of accuracy and reliability by planning-level analysis methods. In such cases, these first-order methods usually represent the most cost- and time-efficient means for addressing the underlying objectives of the investigation, and the increased accuracy available from more sophisticated and complex methods is neither warranted nor needed. It is important to note that critical review and interpretation skills are necessary even when applying such simple analysis methodologies as the planning-level techniques described in this problem. Sub-problem 6d, in particular, illustrates how a careful and critical review of the initial model outputs leads to a different conclusion than the model initially suggested. A particular strength of the planning-level analysis methodology used in this problem is its ability to guide the analyst to an appropriate intersection design. The relationship between the intersection's geometric characteristics and resultant operational performance measures is clearly delineated by this method, making it a particularly useful tool for highway designers and planners as well as operational engineers. to Problem 6 Discussion |
Page Break
Problem 6: Discussion What did we learn in this problem? We learned how to apply the Quick Estimation Method (QEM) to evaluate signalized intersection performance characteristics. We also learned that the QEM provides a reasonable estimate of intersection sufficiency on the basis of minimal data, including the approach turning movement volumes, the approach lane configurations, and the anticipated method for managing left turns. We saw that the method is a pretty good way to see whether any geometric improvements will be necessary to accommodate the anticipated travel demands, particularly when working with future travel demand estimates that have a significant and inherent amount of uncertainty associated with them. Finally, we noted how judgment and critical review is still necessary even when applying the QEM results in order to assure that appropriate conclusions are reached. |