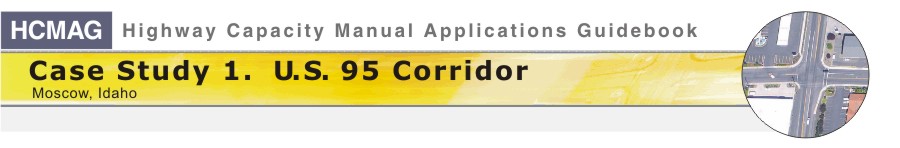
Problem 5: U.S. 95 South of Moscow U.S. 95 continues south out of Moscow bound for Lewiston, ID, 32 miles to the south. Exhibit 1-42 shows an aerial photograph of about a four-mile stretch of the highway just south of Moscow. A short length of suburban two-lane arterial leads quickly to a rural two-lane highway. The state highway agency would like to evaluate the performance characteristics of U.S. 95 as a single facility. To help address this issue, we will explore issues related to the short section of U.S. 95 that acts as a main street for the somewhat developed area you can see toward the bottom of the aerial photograph. Currently, the development in this area does not generate much activity, but trip making is expected to increase over the next 10 years as the area grows. Current estimates are that 10 years from now U.S. 95 south of Moscow will carry about 1,100 vehicles per hour during the PM peak and about 700 of these trips will be generated by the development area (400 originating and 300 destined for this area). Another 300 will be bound toward Moscow from this area, which we will hereafter refer to as a hamlet. In addition, the hamlet will generate a total of about 2,000 vehicle trips during the PM peak (the 700 trips mentioned above are included in this figure), 100 of these trips will go to and from points further south, and the remaining 1,200 trips will be local within the hamlet. How will U.S. 95 operate in the future based on these forecast traffic conditions? Continue to the next page for additional discussion. |

Page Break
|
Exhibit 1-42. U.S. 95 South of Moscow
|
Page Break
Problem 5: U.S. 95 south of Moscow Problem Definition Notwithstanding the absence of a standard planning-level analysis procedure, practical considerations require that the state highway agency have and employ a defensible procedure for evaluating the performance of this highway section under both existing and future conditions, allowing it to make plans and establish capital improvement programs that reasonably rely on the results of the evaluation process. |
||
Page Break
|
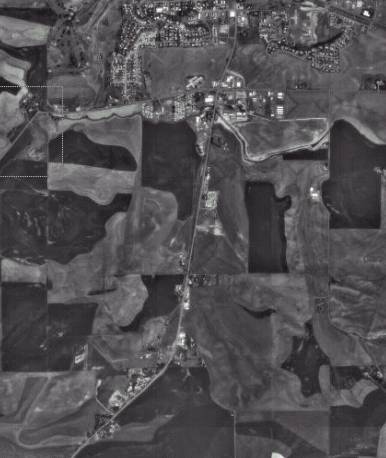
Exhibit 1-43. Study area for Two-Lane Rural Highway Analysis
|

Page Break
Problem 5: U.S. 95 south of Moscow It is also recognized that, in real terms, the range of potential solution alternatives to any deficiencies that might be identified is fairly limited:
Exhibit 1-43 shows a schematic of the area being studied. First, there is a 4.5 mile section of two-lane rural highway, then the 1-mile section through the hamlet, then another 4.5-mile section of two-lane highway. The figure also provides you a broad-brush sense of the traffic volumes. Whether a bypass is built or not, the figure shows that during the PM peak hour, there are 600 vehicles traveling south and 500 traveling north. Of the 600 coming south, 400 are destined for the hamlet, while the remaining 200 are going further south. Another 50 vehicles originate in the hamlet for trips further south so that the southbound volume below the hamlet is 250 vehicles per hour. In the northbound direction, the flow rate is 250 vehicles per hour just south of the hamlet. Fifty of these vehicles are destined for the hamlet and the remainder are traveling further north toward Moscow. An additional 300 trips originate in the hamlet bound for Moscow and further north. This means the northbound volume just above the hamlet is 500 vehicles per hour. Analysis
Plan Sub-problem 5a: Existing analysis of 10-mile segment of U.S. 95 Sub-problem 5b: Future analysis of 10-mile segment of U.S. 95 with recognition of the hamlet |
Page Break
Sub-problem 5a: Existing Analysis of 10-Mile Segment of U.S. 95 Step 1. Setup In sub-problem 5a, we will evaluate the operational characteristics of a 10-mile section of U.S. 95 under existing conditions. Here are some issues to consider as you proceed with the analysis of the existing 2-lane highway and its performance.
Discussion: |
Page Break
Sub-problem 5a: Existing Analysis of 10-Mile Segment of U.S. 95 Step 2: Setup What data are required for the analysis? We want to determine the LOS that drivers experience on the existing 10-mile section. The analysis methodology contained in Chapter 20 of the HCM is applicable, and the following data are needed to conduct an operational analysis:
Today, the average daily traffic on U.S. 95 is about 600 vehicles per hour (both directions). Insofar as the input parameters are concerned, we’ve found from field studies that the shoulder widths are 6 feet, the lane widths are 12 feet, and the directional split is 54% southbound/46% northbound, consistent with the southbound side of the Styner-Lauder intersection that serves as the northern border of this corridor. The peak hour factor (PHF) is set to the HCM-recommended default value of 0.88, the percentage of trucks and buses is 10%, and there are no recreational vehicles. The base free-flow speed is 60 mph, the percent no-passing zones is 30% and there is an average of 2 access points per mile (an access point is a street, a driveway, or a curb cut that is significant in terms of traffic operations.) |
Page Break
Sub-problem 5a: Existing Analysis of 10-Mile Segment of U.S. 95 What other factors should be considered? The service measures for a two-lane highway are dependent on the classification of the facility. Two-lane highways are categorized primarily on the purpose they serve in the transportation system. Class I highways are facilities where speed is an important determinant of the quality of service—motorists traveling on these facilities have an expectation and desire to travel at relatively high speeds. For Class II highways, speed is not an important determinant of the quality of service, and drivers are affected primarily by the amount of time they spend following other vehicles. The service measures that define LOS for Class I facilities include both percent time following and speed. For Class II facilities, LOS is defined solely in terms of percent time spent following. What measure should be used to determine the performance of the facility? Since U.S. 95 is currently a Class I facility, we will focus on travel speed and percent time following. Application of the HCM methodology indicates that the average travel speed is 52.4 mph, it takes 11.5 minutes to traverse the total 10-mile segment, and the percent time spent following is 55.7%. This translates into a level-of-service "C". |
Page Break
Sub-problem 5b: Future Analysis of 10-Mile Segment of U.S. 95 With Direct Recognition of the Hamlet In sub-problem 5b, we will consider future conditions on U.S. 95 and how the changing characteristics of the section of two-lane highway that passes through the hamlet require a different approach in our analysis. Consider the following questions as you prepare to undertake an analysis and evaluation of future conditions along this 10-mile segment of U.S. 95:
Discussion: |
Page Break
Sub-problem 5b: Future Analysis of 10-Mile Segment of U.S. 95 With Direct Recognition of the Hamlet Let's discuss each of these issues and how each affects the operational analysis that we are about to complete. What can be done to assess the future performance characteristics of the one-mile section of U.S. 95 that passes through the hamlet? As development occurs and the speed limit on the one-mile section of U.S. 95 passing through the hamlet drops toward 35 mph, this section of roadway will no longer function as or be perceived as a traditional two-lane highway. Thus, the analysis methodology described in Chapter 20 of the HCM will no longer be directly applicable. This leaves us with the need to find an alternative and reasonable analysis procedure. For purposes of this discussion, we'll consider three options.
Under future conditions, the section of U.S. 95 that passes through the hamlet will effectively operate like an urban arterial segment as described in the HCM, but with segments defined by the unsignalized intersections instead of signalized intersections. In this case, it is the unsignalized intersections that introduce delay to through vehicles on the system. Using a methodology that is consistent in its logic with the analysis procedure for urban streets, we might consider using the posted speed to estimate unimpeded travel time then add to this the delay that through vehicles can be expected to incur at each unsignalized intersection. These two values can then be combined into a single overall estimate of average travel speed on the section of U.S. 95 that passes through the hamlet. |
Page Break
Sub-problem 5b: Future Analysis of 10-Mile Segment of U.S. 95 With Direct Recognition of the Hamlet How can the estimated performance characteristics of
the section of U.S.
95 that is within the hamlet be incorporated into an overall assessment of the
10-mile segment? As described on the previous page, we will use two different HCM
procedures to assess the entire section of U.S. 95. We’re going to use the two-lane rural
highway methodology to analyze the 4.5-mile segments north and south of
the hamlet. We’re going to see
what the delays are to the main street through vehicles for the section of
U.S. 95 that passes through the hamlet, add those delays
together, and compute an overall travel time through the hamlet. We’re
then going to combine this time with the times we get for the 4.5-mile
highway segments north and south of the hamlet. From the combined travel
time we can compute an
average travel speed. For a two-lane highway analysis, level of service is based on the percent time spent following (PTSF) other vehicles. Because our proposed methodology is inconsistent with the procedures outlined in Chapter 20 of the HCM, we won't be able to calculate an overall PTSF for the 10-mile section of U.S. 95. This means we won't be able to translate our analysis into an overall LOS estimate for the entire section of U.S. 95. Also, as we noted earlier, this section of U.S. 95 does not function as a two-lane highway. Even so, the capacity of the hamlet section of U.S. 95 should be consistent with the estimates provided in Chapters 17 and 20 of the HCM (i.e., about 1,700 vehicles per hour for a single direction or 3,200 vehicles per hour for both directions). Therefore, a v/c ratio may be reasonably estimated for each section. |
Page Break
Sub-problem 5b: Future Analysis of 10-Mile Segment of U.S. 95 With Direct Recognition of the Hamlet Step 2. Setup As noted earlier, the analysis stage for this sub-problem requires that we use a combination of two analysis methodologies to evaluate the future operational characteristics of the 10-mile section of U.S. 95. One of these methodologies employs the procedure described in Chapter 20 of the HCM for a Class I two-lane highway facility. The other methodology is based on intuition and logic for the purpose of estimating a key performance measure (average travel speed) on the section of U.S. 95 that passes through the hamlet. Here are some issues to consider as you proceed with the analysis of the future conditions.
Discussion: |
Page Break
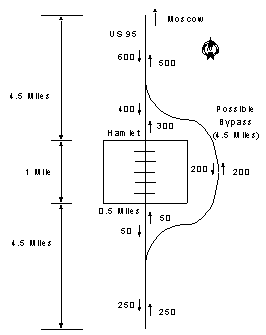
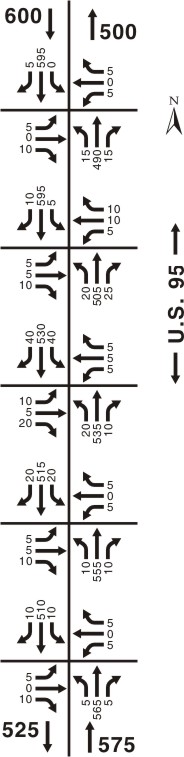
Sub-problem 5b: Future Analysis of 10-Mile Segment of U.S. 95 With Direct Recognition of the Hamlet What volumes should be used in the future conditions analysis? Since the future conditions do not yet exist in the hamlet, we must project or forecast the expected traffic conditions, estimate the resulting intersecting volumes, and do the capacity analysis as outlined previously. Exhibit 1-44 shows the intersecting volumes that have been projected. For this analysis, the volumes into and out of each cross street were estimated on the basis of the types and densities of land uses that each cross street is expected to serve. What additional assumptions are necessary for the analysis? Exhibit 1-45 shows the results from analysis of the five unsignalized intersections. You can click here to see the five datasets. Additional information necessary to this analysis included assumptions regarding the peak hour factor, heavy vehicle percentages, and geometry.
You probably recall that the HCM unsignalized intersection analysis procedure assumes the Rank 1 through and right-turning movements on the major street don't yield to any other movements. Why, then, is there a small amount of delay reported in Exhibit 1-45 for these movements (NB through/right and SB through/right)? The answer lies in the fact that, on this particular two-lane highway, no separate lane is provided for vehicles turning left from the major street onto the minor streets. When no left-turn pocket is provided on the major street, a delayed left-turn vehicle will occasionally block the Rank 1 vehicles behind it. The HCM procedure accounts for this delay to Rank 1 vehicles, as shown in Exhibit 1-45. For the purpose of this sub-problem, we have assumed the default values presented in Chapter 17 for unsignalized intersections. In addition to these default values, we used the intersecting volumes shown in Exhibit 1-44, a PHF of 0.88, 10% trucks, and flares of 2, 3, 2, 1, and 1 vehicle at intersections 1-5 respectively based on geometric data collected in the field. |
|||||||||||||||||||||||||||||||||||||||||||||||||||||||||||||||
Page Break
|
Exhibit 1-44. Intersecting Volumes at the Hamlet on U.S. 95
|
Page Break
|
Sub-problem 5b: Future Analysis of 10-Mile Segment of U.S. 95 With Direct Recognition of the Hamlet What common measure should be used to determine the performance of the facility throughout the various sections? As described in Chapter 28 of the HCM, mean delays can be converted into travel times to describe the performance of the system. This is what we will do here. The main observation in the context of this analysis is that the delays to the main street (highway traffic) through and right-turn movements are not substantial. Delay summed across all intersections totals 2.8 seconds in the northbound direction and 4.8 seconds in the northbound direction. Control delay accounts for the time associated with acceleration and deceleration time, move-up time, and stopped time. If we assume that the through vehicles are traveling at 35 mph (which implies 103 seconds to traverse the one-mile length of the hamlet), the travel time northbound will be 105.8 seconds (1.76 minutes) and southbound it will be 107.8 seconds (1.80 minutes), which translates into a travel time of 34.0 and 33.4 mph respectively and an average of 33.7 mph. The overall travel time is now 12.5 minutes compared to 12.0 in the hypothetical base case and 13.2 in the earlier attempt to account for the hamlet. The average travel speed is 47.9 mph and PTSF is 67.7%. In the previous discussion, we are unable to provide a LOS estimate for the entire corridor because we are unable to estimate PTSF for the entire corridor.
|
|||||||||||||||||||||||||||||||||||||||||||||||||||||||||||||||||||||||||||||
Page Break
Sub-problem 5c: 10-Mile Analysis with a By-Pass We need to do
one more analysis to complete the problem. We should consider what would
happen if a bypass were constructed. This is clearly more
hypothetical than the foregoing analysis because it is difficult to
say exactly how long the bypass would be. However, it is useful to make
some reasonable assumptions and review the results. In Exhibit 1-43 we assumed that the bypass would be at least a mile away from the original highway alignment for the entire one-mile stretch of highway that passes through the hamlet. We assumed that coming southbound the new alignment would leave the original alignment one mile north of the hamlet, follow back-to-back 1-mile radius curves turning 45o each, so that the bypass was one-mile from the hamlet where the hamlet starts. It would then progress one mile south paralleling the original highway and then return to the old alignment a mile further south following another pair of back-to-back 1-mile radius curves turning 45o each. The result is that the new highway segment will be 11.1 miles long (11.1=3.5+1.57+1+1.57+3.5) instead of 10. It will be comprised of one 3.5 mile-long segment having a two-way volume of 1,100 vph, a 4.14 mile-long section with 400 vph, and a 3.6 mile-long segment with 500 vph. Exhibit 1-47 shows the results. The average travel speed with the bypass is higher (50.7 mph versus 47.9) and PTSF is lower (63.7% versus 67.7%). However, the overall travel time is slightly longer (13.1 minutes versus 12.5 to pass through the hamlet) due to the additional 1.1 miles involved.
[ Back ] to sub-problem 5b [ Continue ] to Problem 5 Analysis |
|||||||||||||||||||||||||||||||||||||||||||||||||||||||||||||||||||||||||||||||||||||||||||||||||||||||||
Page Break
Problem 5: Analysis The HCM2000 method for analyzing two-lane highways does not provide much direction for evaluating segments that pass through small nodes of roadside development. An intuitively-based approach relying on first principles of traffic flow theory was used to conclude that the effects of the Hamlet on through-vehicle speeds and delays is not substantial. In different situations, of course, an entirely different outcome might occur. |
Page Break
Problem 5: Discussion What have we learned? We have discovered that the two-lane rural highway analysis method has some difficulty dealing with hamlets. It has difficulty both determining the PTSF and the average travel speed. We know for the hamlet that the PTSF should be 100%. We have over-ridden the methodology’s estimate of 71.6% and entered 100% in the table. The method also seems to underestimate the speed. An analysis based around the TWSC unsignalized intersection analysis procedure leads us to conclude that the average speed through the hamlet should be about 33.3 mph instead of 24.3 as predicted by the two-lane rural road methodology. We have also seen that if we explore an alternate solution strategy of building a bypass there may be a tradeoff involved. The PTSF improves, as does the average speed, but the total travel time across the highway segment is a minute longer due to the extra travel distance involved. Keeping with the original way that the problem was posed, Idaho Transportation Department will have to decide if the extra minute of travel time is a fair tradeoff for the improved perception of highway performance. to Problem 6 |