|
network
configuration (highway sections and their connections) |
|
link distances set
to values obtained from the local MPO (Metropolitan Planning Organization)
accurate to the nearest 10 feet |
|
geometrics for all
highway segments |
|
freeway free-flow
speed density functions set to a minimum of 50 mph and a maximum of 60 mph |
|
ramp speed density
functions for the loop ramps, etc., set to a minimum of 22 mph and a
maximum of 28 mph |
|
ramp speed density
functions for the right-hand ramps and semi-direct ramps set to a minimum
of 43 mph and a maximum of 48 mph |
|
ramp speed density
functions for all remaining facilities set to a minimum of 27 mph and a
maximum of 35 mph |
|
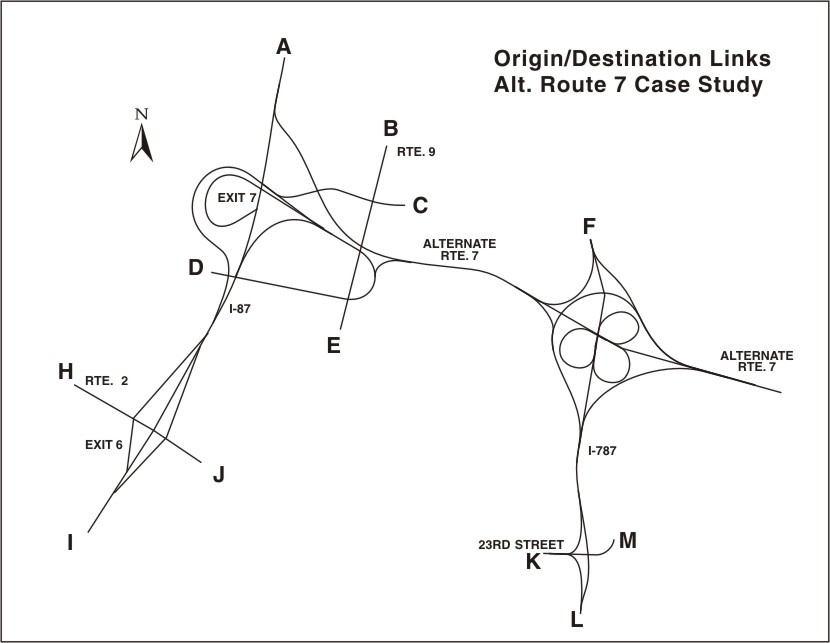
trip matrix using
locations A through M in Exhibit 4-78 as
the origins and destinations |
|
heavy vehicle
percentages set nominally at 5% throughout the network |