Problem 6: Route 146 Arterial Study So far, we’ve looked
only at individual intersections. We’ve ignored the way in which the
intersections interact and the challenge of finding a way to coordinate
the signals.
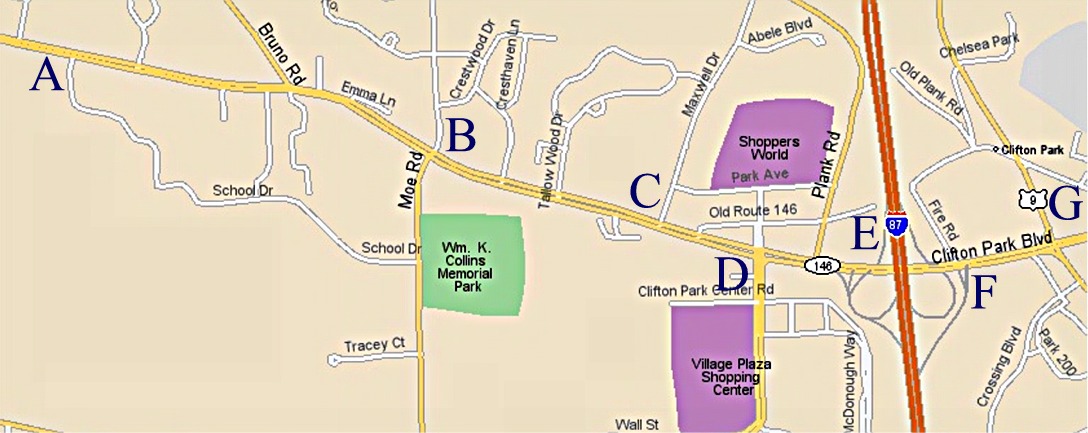
This problem speaks to that issue. We’re going to look at seven intersections simultaneously: the Shenendehowa Campus entrance, Moe Road, Maxwell Drive, Clifton Country Road, the I-87 Interchange, Fire Road (the signalized intersection on the east side of the interchange, Intersection F) and Route 9 (Intersection G) simultaneously. Refer to Exhibit 2-1 to become familiar with the intersection locations. |
Page Break
Problem 6: Route 146 Arterial Study
Analysis
Plans We will exercise TRANSYT7-F in simulation mode to see how it thinks the network is performing. Finally, the analysis software will optimize the performance of the network as a coordinated system to see the optimal signal timings should be. with Analysis |
Page Break
Problem 6: Route 146 Arterial StudyAnalysis First, you
will need to
specify the lane arrangements at the various intersections. Here’s what
we decided was appropriate. The abbreviations should be easy to read, and the
numbers in parentheses, where they appear, imply more than one lane:
You can revisit the
Exhibit 2-2 (the Route 146 aerial photograph) to see if you agree with
these decisions. For the first four intersections, you can also review the
HCM
input datasets. For the I-87 interchange, we only needed to
model the westbound-to-northbound entry ramp, westbound-to-southbound left
turn onto the southbound entry ramp, the southbound-to-westbound exit
ramp, the eastbound-to-southbound entry ramp, and the
southbound-to-eastbound exit ramp to capture the impacts of traffic
enteLevel of Servicend leaving the system. (If you know TRANSYT-7F, you’ll realize
that you can’t model these flows accurately just with the mid-block entry
option.) The geometry of the Fire Road intersection was presented in
Exhibit 2-48.
Exhibit 2-64 contains
the configuration of the Route 146 and Route 9 intersection.
|
Page Break
|
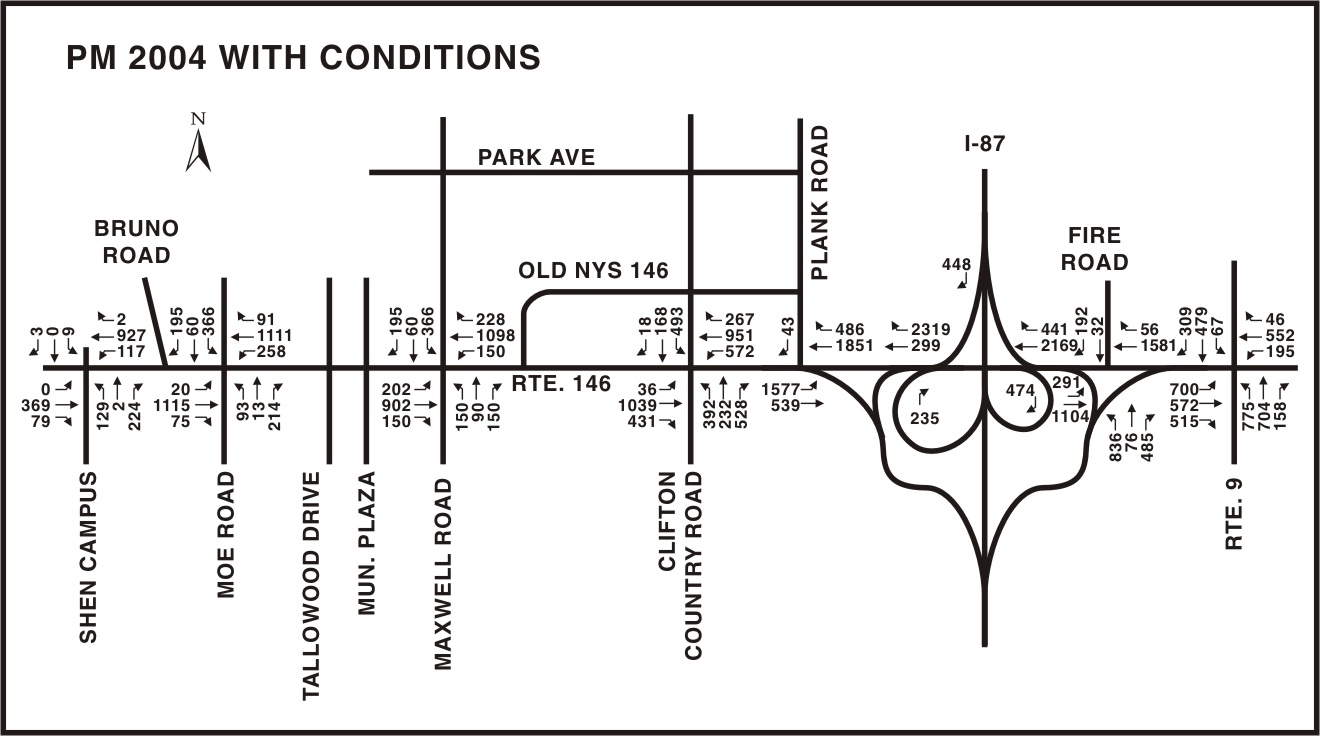
Exhibit 2-65. Route 146 Network Volumes - PM With Condition
|
Page Break
Problem 6: Route 146 Arterial StudyThe PM Existing and PM Without volumes used in the analysis are shown in Exhibit 2-65. There are unsignalized side streets in the network, such as Bruno Road, Tallowood Drive, and the Municipal Plaza, but the traffic volumes on these roads are not substantial. You’ll also see the tangential network involving Old NYS 146, Park Avenue, and Plank Road that we’ve decided to omit from the present analysis. You could argue that at least the extension of Clifton Country Road north across Old NYS 146 and Park Avenue should be included because there are times when the queue at Route 146 does back up across the Old NYS 146 intersection. In this analysis we haven’t done that. The other information we had to specify
included:
to Findings |
Page Break
Problem 6: Route 146 Arterial StudyFindings
Our
first run involved simulating the network using the signal timings
developed in the HCM analyses. Complete datasets for the two main runs we performed
are available for T7F1
and T7F2
signal timings.
As you can see, at the
Shen entrance, we didn’t need to adjust the signal timings very much
to get acceptable performance from TRANSYT-7F at that intersection. The
same is true at Moe Road and Clifton Country Road. Only at Maxwell
Drive, and only for Phases 1 and 3 (the left-turn phases), that we needed
to adjust the signal timings (substantially) in TRANSYT-7F to get
acceptable v/c ratios. The third green times (T7F2) are the values developed by TRANSYT-7F in optimizing the coordinated performance of the network. To give you a sense of the performance improvement provided with the T7F1 signal timings, the network had 300 vehicle-hours of delay (out of 455 total vehicle-hours of travel), while in the optimized scenario (T7F2), there were 282 vehicle-hours of delay (8% less) out of 436 vehicle hours of travel. The original signal timings were already fairly well matched to the traffic flows. One important point to note about the analysis pertains to the westbound-to-southbound left turn at the I-87 interchange. We specifically included the I-87 interchange as a node in the network so we could look at the performance of this movement. In the T7F1 run, this movement had a degree of saturation of 145%, well above the 95% that TRANSYT-7F sets as an upper limit. We saw this as a significant problem and determined that some action would have to be taken to mitigate the long delays that occur there. It is
interesting to note that in the T7F2 solution, that problem has been
rectified. TRANSYT-7F found a way to coordinate the signals at Clifton
Country Road and Fire Road so the left turn can have a degree of
saturation equal to 101%. This is not as good as the 95% that’s desirable,
but it is much better than the 145% we had in the first case. to Discussion |
|||||||||||||||||||||||||||||||||||||||||||||||||||||||||||||||||||||||||||||||||||||||||||||||||||||||||||||||||||||||||||||||||||||||||||||||||||||||||||||||||||||||||||||||||||||||||||||||
Page Break
Problem 6: Route 146 Arterial Study
Discussion The second observation is that the way the HCM treats these intersections is very similar to the way they are treated in TRANSYT-7F. The two analytical methods expect very similar inputs, treat the problem in similar ways, and produce similar outputs. If you review the Help screens and text in TRANSYT-7F, you will find numerous references to the HCM. This indicates a significant consistency between these two tools, providing some assurance that findings obtained from the HCM will be similar to those from TRANSYT-7F, and vice versa. The one major
difference between the HCM and TRANSYT-7F is that the capacities of the saturation flow rates are derived by the HCM, whereas they are
inputs in the case of TRANSYT-7F. Oftentimes, it helps to do the HCM
analyses first and get credible saturation flow rates for the various lane
groups before starting a TRANSYT-7F analysis. That will increase
the consistency of the results you obtain. [ Continue ] to HCMAG Home |